UK Food Waste Statistics 2025: The 2025–26 Data Every Business Should Know
UK food waste statistics for 2025–26 reveal a crisis that costs businesses billions and generates millions of tonnes of avoidable CO₂. This data-driven guide compiles the latest figures from WRAP, DEFRA, ONS and the Environment Agency — and shows what effective commercial food waste management looks like in practice.
- 9.5M tonnes of food wasted annually across the UK food system (WRAP, 2023)
- £19bn estimated total annual cost of UK food waste to the economy
- £126.15 per tonne — UK landfill tax standard rate, April 2025–26 (HMRC)
- 36% of all UK food waste originates from the hospitality & food service sector
Commercial food waste management in the UK is no longer purely an environmental concern — it is a financial and regulatory imperative. Yet many businesses are still making decisions without access to accurate, current data. This article compiles the most important UK food waste statistics available for 2025–26, drawing on primary sources from WRAP, DEFRA, HMRC and ONS, and translates them into practical implications for businesses that produce commercial food waste every day.
Whether you are a hotel GM reviewing operational costs, a school business director navigating Simpler Recycling 2025 compliance, or an NHS Estates lead preparing a Green Plan sustainability report, these numbers matter — and they are getting worse every year that on-site commercial composting or compliant food waste treatment is not in place.
The UK Food Waste Picture: Total Scale and Economic Cost
The UK generates approximately 9.5 million tonnes of food waste per year across the entire food system — from farm to fork — according to WRAP’s most recent Food Surplus and Waste in the UK report. Of this, the food service and hospitality sector contributes around 1.1 million tonnes annually, generating an estimated £3.2 billion in direct business costs every year.
These figures include:
- The cost of the food itself — purchased, prepared and then wasted
- Waste disposal contract costs — collection, transport and tipping fees
- Landfill tax pass-through embedded in contractor invoices
- Staff time spent on waste handling, separation and record-keeping
- Reputational costs associated with poor sustainability performance
What most businesses do not account for is the compounding effect of rising landfill tax. At £126.15 per tonne in 2025–26 — a 21.6% increase on the previous year — the financial penalty for sending food waste to landfill is now a material P&L line item rather than a rounding error.
Practical implication: A mid-sized hotel generating 500 kg of food waste per week is incurring approximately £3,278 per year in landfill tax exposure alone — before the collection contract cost is added. Use the free ROI calculator at 3rurban.co.uk to model your specific figures.
UK Food Waste by Sector: Where Commercial Food Waste Management Is Most Critical
The following table draws on WRAP’s sector-level data and DEFRA’s published waste statistics to show food waste volumes and estimated costs by commercial sector. These figures represent the commercial food waste management challenge in its full scale:
| Sector | Annual Food Waste (tonnes) | Estimated Annual Cost | Primary Driver |
|---|---|---|---|
| Restaurants & Hospitality | ~920,000 | ~£2.9bn | Plate waste, over-ordering, spoilage |
| Hotels & Resorts | ~190,000 | ~£600m | Breakfast buffets, banqueting, room service |
| Education (schools, colleges, universities) | ~115,000 | ~£360m | Canteen plate waste, over-preparation |
| NHS & Healthcare | ~70,000 | ~£220m | Patient meal rejection, catering over-production |
| Councils & Public Bodies | ~40,000 | ~£126m | Civic catering, events, community facilities |
Sources: WRAP Food Surplus and Waste in the UK 2023; DEFRA UK Statistics on Waste 2024; WRAP Hospitality & Food Service Agreement data.
Note on methodology: Sector tonnages represent food waste generated within operations — they do not include upstream supply chain losses. The costs shown reflect estimated direct disposal and food purchase costs for waste produced. Carbon costs are not included in these financial figures.
The Carbon Cost: What UK Food Waste Statistics Tell Us About Climate Impact
Food waste is not simply a financial problem — it is one of the most significant drivers of avoidable greenhouse gas emissions in the UK. When food waste decomposes in landfill in the absence of oxygen, it produces methane — a greenhouse gas with a global warming potential approximately 80 times greater than carbon dioxide over a 20-year period, according to the IPCC Sixth Assessment Report.
WRAP’s published carbon conversion factors for food waste are among the most cited in UK sustainability reporting:
| Treatment Route | Carbon Impact (tCO₂e per tonne of food waste) | Net Saving vs Landfill |
|---|---|---|
| Landfill disposal | +0.43 (methane released) | Baseline — no saving |
| Anaerobic digestion (via collection) | −0.19 | 0.62 tCO₂e saved per tonne |
| In-vessel aerobic composting (on-site) | −0.37 | 0.80 tCO₂e saved per tonne |
Source: WRAP, Methodology for Estimating the Carbon Impact of Food Waste, 2023.
In practical terms, a secondary school generating 75 kg of food waste per day — 27.4 tonnes per year — would save approximately 21.9 tonnes of CO₂ equivalent per year by switching from landfill disposal to on-site in-vessel aerobic composting. This is directly reportable in Eco-Schools applications, TCFD climate disclosures and public sector sustainability reports.
The Landfill Tax Trajectory: What the Numbers Mean for Your Business in 2026 and Beyond
The UK landfill tax has been rising consistently since its introduction in 1996. The following progression illustrates the rate of increase in recent years and its direct impact on commercial food waste management costs:
| Financial Year | Standard Rate (per tonne) | Year-on-Year Increase |
|---|---|---|
| 2022–23 | £98.60 | +£1.60 |
| 2023–24 | £102.10 | +£3.50 |
| 2024–25 | £103.70 | +£1.60 |
| 2025–26 | £126.15 | +£22.45 (+21.6%) |
Source: HMRC, Landfill Tax rates and notices, April 2025.
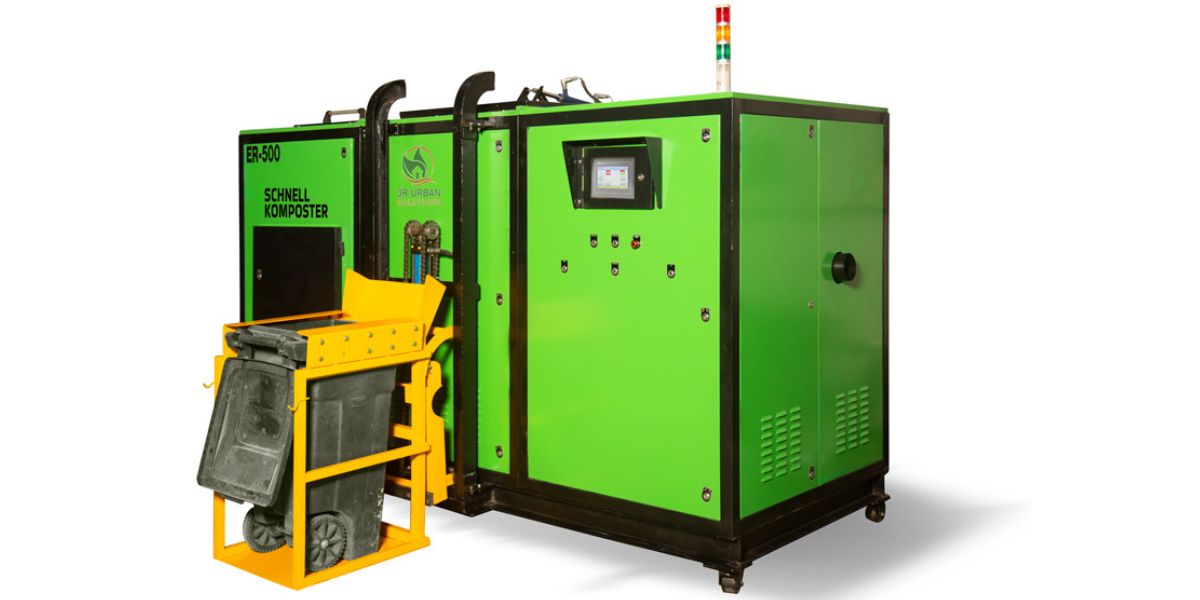
The 21.6% single-year jump from 2024–25 to 2025–26 is the steepest in the tax’s history. The Office for Budget Responsibility has signalled continued escalation in line with inflation plus a real-terms uplift. For any business calculating the payback period on a commercial composting machine or on-site composting system, this trajectory means the real-world payback will arrive sooner than even a 2025 financial model suggests.
Key point: A business modelling payback on today’s landfill tax rate of £126.15 per tonne is actually being conservative. If the rate continues to rise at its 2025–26 rate, the same waste volume will cost £150+ per tonne by 2027–28 — improving the payback case every year.
UK Commercial Composting: Where Is the Industry Now?